MGA - Master Gann Analyzer
Manual
v.3
2.6. Cycles.
To search for dates on which the largest number of cycles are superposed select this menu item or click on the  button of the toolbar.
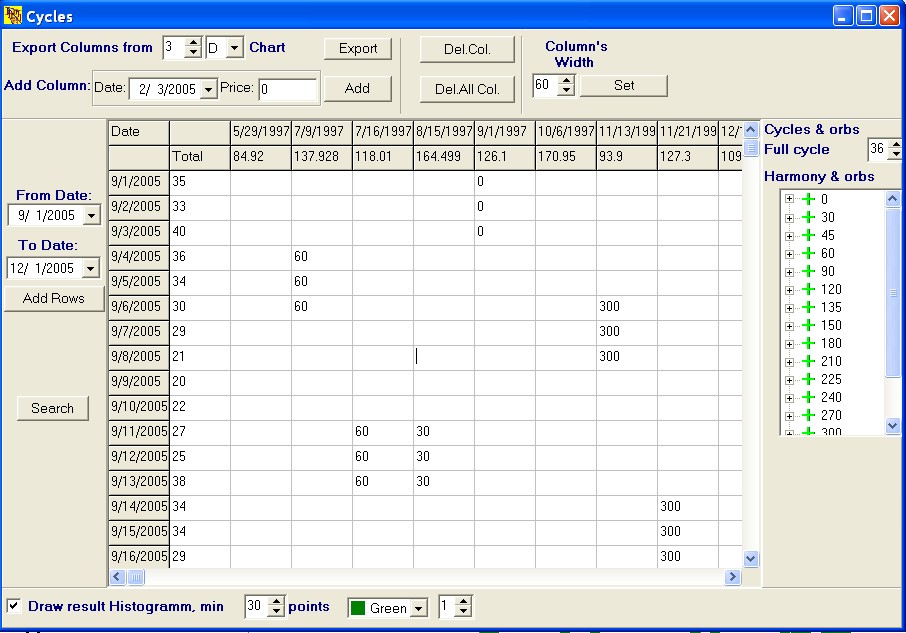
The лCycles╗ window will then open:

The лCycles╗ window consists of four blocks and a table. In the columns of the central table there are important dates from the price history of the given security. In the rows of the table Ц the date we would like to study (commonly future dates, but you can as well backtest this tool).
The upper block allows to modify the columns of the central table (add, remove etc.)
There are two ways of adding a column:
- by exporting dates from the swings,
- by entering them manually.
If you want to delete either a current (that selected by the mouse) column or all the columns from the table you can use the лDel.Col.╗ or лDel.All Col.╗ buttons.
To set the column width change the лColumnТs width╗ field and the лSet╗ button.
The toolbar on the left is used for manipulating the rows of the central table.
New rows can be added in the following ways: select the first date Ц лFrom Date╗ Ц in the dropdown calendar (or type it on the keyboard), enter the final date - лTo Date╗ - and press the лAdd Rows╗ button.
The лSearch╗ button at the bottom launches the search of cycles supperposition.
The toolbar on the right allows to manipulate the harmonies and the periods of the cycles.
The period of the complete cycle can be entered in the лFull cycle╗ field. This parameter is used to calculate the difference (absolute value) between dates, for example: the 545 days difference corresponds to 180 days (as |365-545| equals180).
The values of harmonies are listed in the hierarchical tree лHarmony & orbs╗.
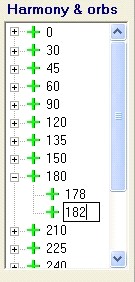
 Clicking on each item in the list we can see the initial and the final values of a cycle (the value at which it is shown in the central table). For example, clicking on the 180 days cycle (click У+Ф at the left of 180) we will see two values: 178 and 182. It means that we set the orbis for the influence of this cycle two days before and two days after its value.
To modify the value of an orbis, click it once and after a short pause click it again. After modifying the orbis click enter to save the change.
Having set and/or modified all the parameters donТt forget to press the лSearch╗ button to recalculate the cycles.
The central table shows only the final calculations. In its columns there are important dates for the given security, and in the rows Ц dates we want to study, the cells of the table contain the cycles. The second column (on the left) - лTotal╗ contains the number of cycles which are in action on each date we would like to study.
Double-clicking on the central table will maximize it and hide all the toolbars, which is convenient when you are looking through a large data array. Double-clicking on the table once again will switch the table to the initial position.
The toolbar at the bottom allows you to display the final calculations on the chart.
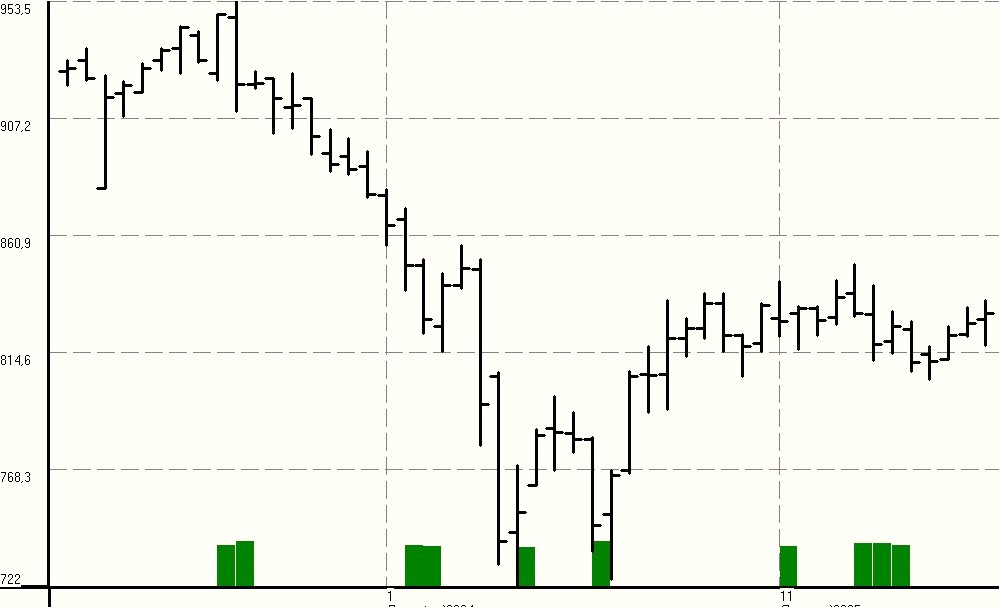
Check the box лDraw result Histogramm╗ to display the results on the chart. A histrogram of the selected color and line width will be plotted. The numbers from the лTotal╗ column less then the value set in the лMinimum points╗ field will be ignored, which is a sort of filter.
You can save or view the cycles saved earlier by opening the context menu (right-click of the mouse).
An example of using the cycles is shown below on the chart of the Lukoil stocks Ц the picture hardly needs any comments (!):

Back to Content
 button of the toolbar.
 Clicking on each item in the list we can see the initial and the final values of a cycle (the value at which it is shown in the central table). For example, clicking on the 180 days cycle (click У+Ф at the left of 180) we will see two values: 178 and 182. It means that we set the orbis for the influence of this cycle two days before and two days after its value.