MGA - Master Gann Analyzer
Manual
v.3
2.4. Functions (╘ґэъІшш).
To configure the planetary lines select this menu item or click the button to open the УTune of functionsФ menu.
This window represents a УtreeФ composed of three levels:
Gann Tools,
Fibo,
AstroTools.
If you click the left mouse button on choosen level of the tree (on the function), you will see on right side of the window the panel with parameters of this function.
Let us study each of them in detail.
2.4.1. Gann Tools.
Gann HiLo - High / Low activators
4 main parameters:
o Lock backward Ц Ц the УNФ parameter setting the period (number of bars) of the moving average (MA),
o Color
o Width
o Draw Next Time Frame Hi/Lo this option allows you to plot a HiLo activator for a larger periodicity chart (e.g. if we are looking at a daily chart, this function will draw the Gann HiLo line for weekly data).
o Support Ц Support line color,
o Resistense Ц Resistance line color,
o Lock backward Ц the УNФ parameter setting the period (number of bars) of the moving average (MA) Ц it can differ from the value of the previous level Lock backward parameter for the main periodicity chart.
o Width .
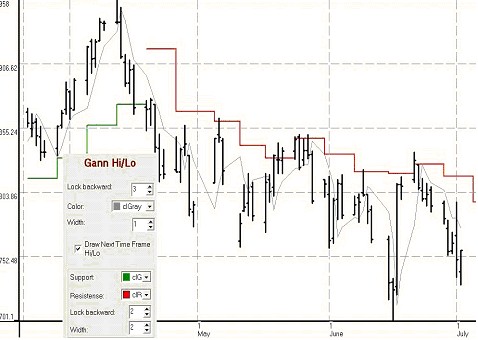
This function allows to determine the begginning of a new trend (optimal moments for trades), as well the levels of support / resistance. You can find a more detailed description of the HiLo activator in Robert KrauseТs articles.
Circel lines (for any number of calendar/trade days, weeks, month Е).
7 main parameters:
o Start data Ц the date opening a cycle (usually an important high or low). You can type the date from the keyboard or find it in the calendar with the mouse.
o Price Level Ц the level where a horizontal line can be drawn with a given period of the cycle.
o Count of periods Ц the period of the cycle
o Time frame Ц time frame of the period of the cycle
o On bars/calendar day Ц trading days / calendar days Ц check this box to calculate the cycle based upon trading days (bars), or leave it unchecked for calendar days.
o Color .
o Width .

The function is designed to determine УtimeФ resistance levels of a security, i.e. the moments when a trend is most likely to reverse.
In the chart above you can see an example of a Circle line in two different time frames (first Ц for a chart, and second Ц for a cycle). Important top of the УLKOHФ stocks was formed on October 06, 2004 at 967 roubles. We plotted a 26-weekly cycle (it cycle is ½ of the 52-weekly cycle) on a daily chart. The line width is 2 and the color is red. In the blue square on the right side we may see this chart more closely in October 2005 with start and end of the cycle. As you may see LKOH formed on this date impotent top.
Next example of this function:
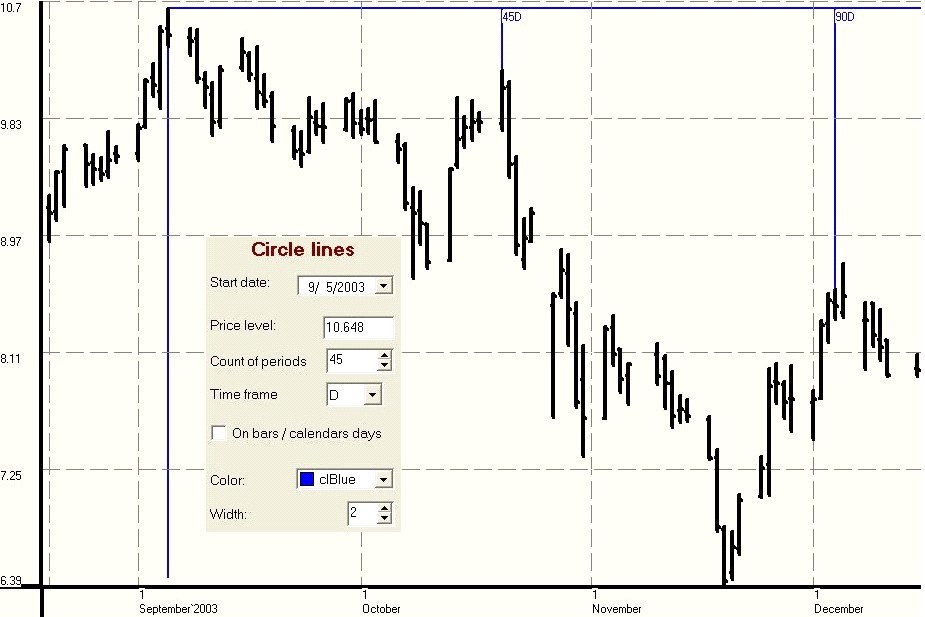
In the chart above you can see an example of a Circle line in Daily time frames (both for a chart and for a cycle). Important top of the УEESRФ stocks was formed on September 05, 2003 at 10.648 roubles. We plotted a 45-daily cycle (it cycle is 1/8 of the full yearly cycle) on a daily chart. The line width is 2 and the color is blue.
As you may see - the results are rather impressing: the first cycle line matches exactly the trend reversal day, the second is plotted one day before the reversal date.
N.B.: if we set Circle line on Daily Time Frame and chart Ц on Weekly (or more) Time Frame, than Cicrle line will not be showing.
Gann Fan .
7 main parameters:
o Start price Ц the price which will be the base point for the lines.
o Start data Ц the date which will be the base point for the lines (usually an important top/bottom). You can type it on the keyboard or select it with the mouse in the calendar.
o Price step Ц price change / time change ratio, i.e. the slope of the lines.
o Count of lines Ц sets the number of the lines (2*N-1) in the fan, where УNФ is the value of the parameter. For instance, if N=1 Ц just one line will be plotted, if N=22 Ц three lines will be plotted (the slope of the first line equals Price step, that of the second Ц Price step*2, that of the third - Price step/2).
o Color .
o Width .
o Direction Ц sets the direction of the angle/line Ц up or down, or both Up and Dn.
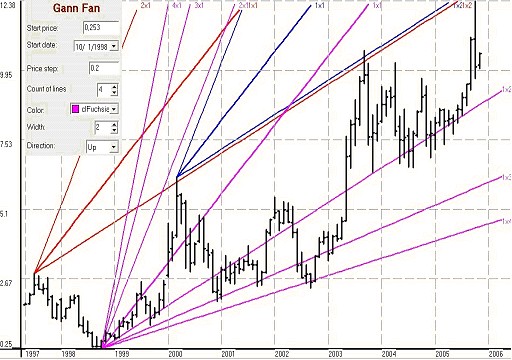
The function is a tool allowing to determine the main support / resistance lines. The chart above shows an example of three Gann fans (the settings of the third are shown in the dialog box on the left).
Square root from extremes .
6 main parameters:
o Data Ц date on which the price formed a reversal (usually an important top / bottom). You can type the date on the keyboard or select it with the mouse.
o Square of Low/Hi Ц the value of the bar Ц High or Low from which the square root is extracted.
o Scaling Ц transformation ratio setting the necessary number of digits after the decimal point. For example, the price 10.648 with the scaling parameter = 100 will be transformed into 1064.8, from which square root will be extracted.
o On bars/calendar day Ц trading days / calendar days Ц check this box to calculate the cycle based upon trading days (bars), or leave it unchecked for calendar days.
o Color .
o Width .

The function shows time resistance levels, i.e. the moments when the price is most likely to form a reversal.
Square of minimum (ZeroLine)
7 main parameters:
o Data Ц date on which the price formed a reversal (usually an important top / bottom). You can type the date on the keyboard or select it with the mouse.
o Start price Ц the price which will be the base point for the lines.
o Price step Ц sets the slope of the line, i.e. the speed at which it moves to the Zero Line.
o Harmony Ц Sets the number of lines (2*N-1), where УNФ is the value of the parameter. For instance, if N=1 Ц just one line will be plotted, if N=22 Ц three lines will be plotted (the slope of the first line equals Price step, that of the second Ц Price step*2, that of the third - Price step/2).
o Color .
o Width .
o Draw nul line Ц switches on/off plotting of diagonal lines going from the lows to the zero line. If the parameter is switched off only vertical lines will be drawn.
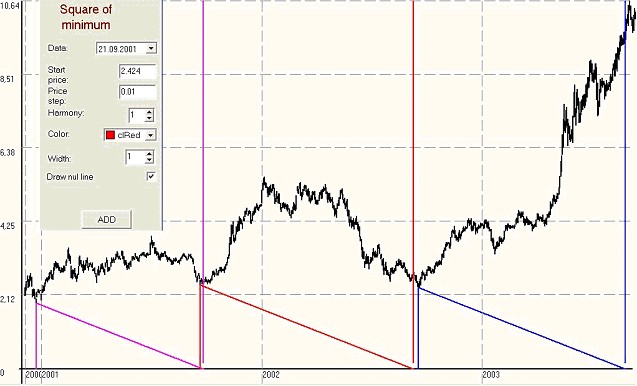
The function shows time resistance levels, i.e. the moments when the price is most likely to form a reversal. The chart contains three lines which have forecast with great exactitude important reversal dates.
Square of maximum (ZeroLine) Ц This function is used in the same way as Square of minimum, with the only exception that it is based upon price highs.
Square of range
9 main parameters:
o Start data Ц date on which the price formed a reversal (usually an important top / bottom). This date will be the base point for the square You can type the date on the keyboard or select it with the mouse.
o Start price Ц the price which will be the base point of the square.
o End data Ц date on which the price formed a reversal (usually an important top / bottom). This date will be the final point of the square You can type the date on the keyboard or select it with the mouse.
o End price Ц the price which will be the final point of the square.
o Price step Ц step at which diagonal lines cross the square (towards the horizontal axis).
o Harmony Ц Sets the number of lines (2*N-1), where УNФ is the value of the parameter. For instance, if N=1 Ц just one line will be plotted, if N=22 Ц three lines will be plotted (the slope of the first line equals Price step, that of the second Ц Price step*2, that of the third - Price step/2).
o Color .
o Width .
o Draw diagonal line Ц check this box if you want to plot the diagonal line from the maximum to the minimum of the square. If the box is unchecked only vertical lines will be plotted.

This function allows to determine price support / resistance levels (horizontal lines within the square) as well as time resistance levels (vertical lines). Horizontal lines divide the square into 8 parts.
The chart above shows two squares of range (monthly data).
Square of 52/90/144 - S52/S90/S144.
You can also plot squares with your own settings.
The function has 9 main parameters:
o Square Ц The number of the square, e.g. sqare of 52, 90, 144 etc.
o Start data Ц date on which the price formed a reversal (usually an important top / bottom). This date will be the base point for the square You can type the date on the keyboard or select it with the mouse in the dropdown calendar.
o Start price Ц the price vale which will be the base point of the square.
o Direction Ц Sets the direction of of the lines of the square (Up Ц up, Dn Ц down, Up & Dn Ц up and down).
o Price step Ц the step at which diagonal lines cross the square along the horizontal axi. This stem also sets the distance between the horizonal lines dividing the square into Square parts.
o Use 1/8 (1/4 or 1/2) Ц Ц Sets the division of the square to be used as well asthe color of the corresponding lines.
o Use 1/3 Ц Check this box and select the color of the lines if you want to divide the square into 3 parts.
o Color .
o Width .

This function allows to determine price support / resistance levels (horizontal lines within the square) as well as time resistance levels (vertical lines). Horizontal lines divide the square into 8 parts.
The chart above shows 2 combined Squares52 (monthly data).
Ganns Master Hexagon Chart.
Levels of Hexagon Price - Price support and resistance levels
The function has 7 main parameters:
o Start number Ц The price level, which will be the base of the hexagon. The default value is 1, but you can also set a number corresponding to an important low of a security.
o Degree/data Ц this parameter shows at which degree (of the external circle of the Zodiac) or date we will plot the line to the center and search for the numbers of the hexagon below that line.
o Harmony sets the number of lines plotted based upon the Degree/data level. 1 Ц just one line, 2 Ц one line and onother one 180 degrees away from the first, 3 Ц 120 away from the first etc.
o Scaling Ц sets the correspondence between prices and the numbers of the circle, as the prices are fractions, the hexagon numbers are integer. For example, to see the level of hexagon for a stock with the price range 2-10, the optimal value of the paramber is 0,01. Increasing the value ofthe parameter we will increase the distance between the levels.
o Color .
o Width .
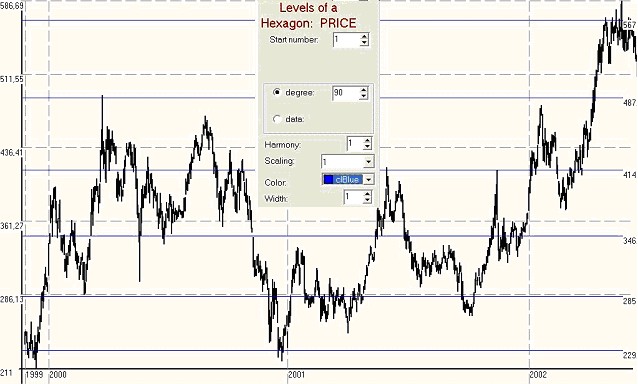
The function allows to determine price support and resistance levels.
Above you can see the daily chart of the Lukoil stocks with the levels of hexagon.
Levels of Hexagon Time Ц Time support and resistance levels
7 main parameters:
o Start data Ц The date which will be the base of the Hexagon. Preferably, an important high or low.
o Degree/data Ц this parameter shows at which degree (of the external circle of the Zodiac) or date we will plot the line to the center and search for the numbers of the hexagon below that line.
o Harmony Ц sets the number of lines plotted based upon the Degree/data level. 1 Ц just one line, 2 Ц one line and another one 180 degrees away from the first, 3 Ц 120 degrees away from the first etc.
o Color .
o Width .
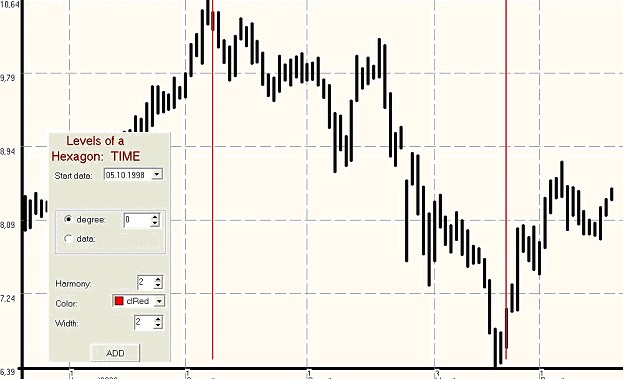
The function was designed to determine time support and resistance levels, i.e. the moments when the price move is most likely to reverse.
Above you can see the daily chart of RAO EES with Hexagon start date 05/10/1998 (historical low) in the second harmony. The vertical levels indicate rather accurately the reversals of price trends.
Ganns Square of 9
Levels of S9 Price Ц Price support and resistance levels
6 main parameters:
o Bull/bear Ц sets the direction of movement of the external circles of the Square9 (degrees and dates) Ц clockwise and anticlockwise.
o Degree/data Ц this parameter shows at which degree (of the external circle of the Zodiac) or date we will plot the line to the center and search for the numbers of the Square9 below that line.
o Start number Ц the number which will be the base for the Square9. The default value is 1, but it can as well be set to an important low of a security.
o Harmony Ц sets the number of lines plotted based upon the Degree/data level. 1 Ц just one line, 2 Ц one line and onother one 180 degrees away from the first, 3 Ц 120 degrees away from the first etc.
o Scaling Ц sets the correspondence between prices and the numbers of the circle, as the prices are fractions, the hexagon numbers are integer. For example, to see the level of hexagon for a stock with the price range 2-10, the optimal value of the paramber is 0,01. Increasing the value ofthe parameter we will increase the distance between the levels.
o Color .
o Width .
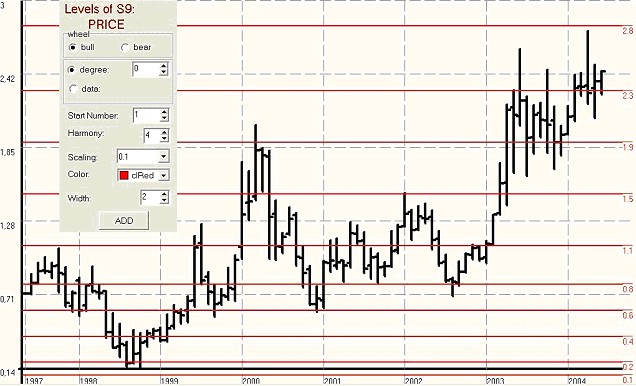
Above is the monthly chart of the MosEnergo stocks with the levels of Square9.
Levels of S9 Time Ц Time support and resistance levels
6 main parameters:
o Start data Ц the date which will be the base for the Square9. Preferably an important high or low of a security.
o Bull/bear Ц sets the direction of movement of the external circles of the Square9 (degrees and dates) Ц clockwise and anticlockwise.
o Degree/data Ц this parameter shows at which degree (of the external circle of the Zodiac) or date we will plot the line to the center and search for the numbers of the Square9 below that line.
o Harmony Ц sets the number of lines plotted based upon the Degree/data level. 1 Ц just one line, 2 Ц one line and onother one 180 degrees away from the first, 3 Ц 120 degrees away from the first etc.
o Color .
o Width .
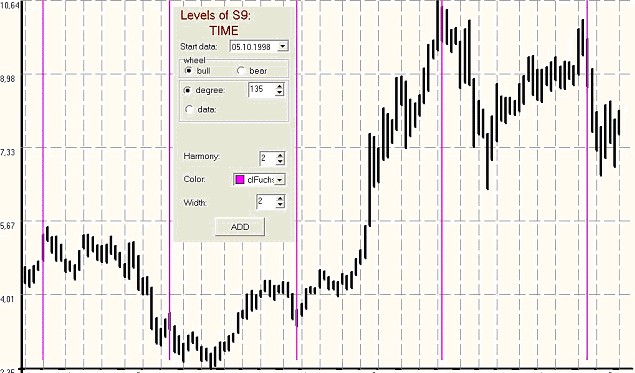
The function allows to determine time support and resistance levels, i.e. the moments when the price move is most likely to reverse.
Above you can see the weekly chart of RAO EES with the Hexagon start date 05/10/1998 (historical low) in the second harmony. The vertical levels indicate rather accurately the reversals of price trends.
Ganns Square of 4
Levels of S4 Price Ц Price support and resistance levels
8 main parameters:
o Bull/bear Ц sets the direction of movement of the external circles of the Square4 (degrees and dates) Ц clockwise and anticlockwise.
o Degree/data Ц this parameter shows at which degree (of the external circle of the Zodiac) or date we will plot the line to the center and search for the numbers of the Square4 below that line.
o Start number Ц the number which will be the base for the Square4. The default value is 1, but it can as well be set to an important low of a security.
o Price step Ц the number which is added to the current cell of the Square as we move to the next cell. For example, we can set the values of both the Start number and Price step to 40. Then the number in the first cell of the Square4 will be 40, that in the second cell Ц 80, that in the third Ц 120 etc.
o Harmony Ц sets the number of lines plotted based upon the Degree/data level. 1 Ц just one line, 2 Ц one line and onother one 180 degrees away from the first, 3 Ц 120 degrees away from the first etc.
o Scaling Ц sets the correspondence between prices and the numbers of the circle, as the prices are fractions, the hexagon numbers are integer. For example, to see the level of hexagon for a stock with the price range 2-10, the optimal value of the paramber is 0,01. Increasing the value ofthe parameter we will increase the distance between the levels.
o Color .
o Width .
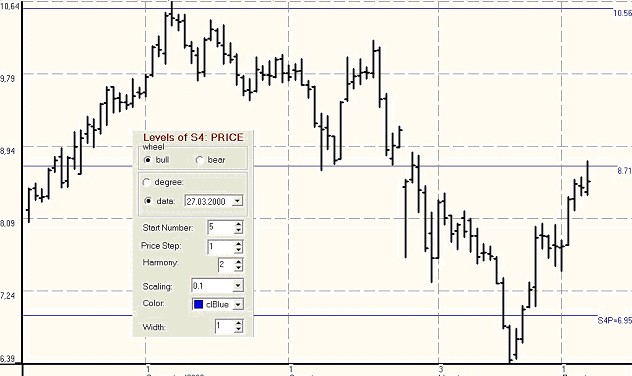
Above you can see the daily chart of the RAO EES stocks with the levels of Square4.
Levels of S4 Time Ц Time support and resistance levels
7 main parameters:
o Start data Ц the date which will be the base for the Square4. Preferably an important high or low of a security.
o Bull/bear Ц sets the direction of movement of the external circles of the Square4 (degrees and dates) Ц clockwise and anticlockwise.
o Degree/data Ц this parameter shows at which degree (of the external circle of the Zodiac) or date we will plot the line to the center and search for the numbers of the Square4 below that line.
o Start number Ц the number which will be the base for the Square4. The default value is 1, but it can as well be set to an important low of a security.
o Harmony Ц sets the number of lines plotted based upon the Degree/data level. 1 Ц just one line, 2 Ц one line and onother one 180 degrees away from the first, 3 Ц 120 degrees away from the first etc.
o Color .
o Width .

The function allows to determine time support and resistance levels, i.e. the moments when the price move is most likely to reverse.
On the chart above (RAO EES, daily) you can see the levels of Square4 (the start date Ц March 27, 2000 Ц an important high) in the 4th harmony (each 90 degrees). The vertical lines show rather precisely price tren reversals.
Back to Content