MGA - Master Gann Analyzer
Manual
v.3
2.2. Planets Hierarchy.
To configure the usage of the planetary lines select this menu or click the button
 on the toolbar which will open the ½Planets Hierarchy╗ window.

This window contains a hierarchichal ½tree╗ with the names of the main planets listed at the first level.
The second level (click ō+ö to open) shows you the types of planetary lines.
Price - is the branch of the ōtreeö used to create Planets price line (PPL). PPL ¢ is a line plotted based upon the planetsÆ relative positions to prices.
Circles ¢ is the ōtreeö branch enabling you to plot Planets circle lines (PčL). PCL ¢ is a (vertical) cylce line designed to search the given position of a planet (for example, a vertical line will be drawn when the Mars is at an angle of 15 degrees with any sign of the Zodiac).
The third level of the ōtreeö contains the type of the line to be drawn:
- Geo ¢ geo-centric coordinates of a planet,
- Helio ¢ helio-centric coordinates of a planet,
- Declination ¢ declination of a planet.
Right-clicking on the items of this window will open a context menu (available for this window only) with the following options:
- Tune configures the settings of the lines to be drawn,
- Edit ¢ opens a window to edit the lines (removed from this version),
- Hide/Show ¢ hide / show a line (lines),
- Delete ¢ remove a line (lines) from the chart.
N.B.: If you select ōDeleteö at the first level of the ōtreeö (e.g. Venus ), i.e. at the level of a planet, all the lines linked to this planet will be removed. Using the ōDeleteö option at the second level of the tree (e.g. Venus-Price ) will delete all the planetary lines (in the geo-, helio-centric coordingates and in declination), leaving the circle lines intact. At the third level of the tree (e.g. Venus¢Price-Geo ) ōDeleteö will remove the lines of a planet in the geo-centric coordinates leaving the lines in the helio-centric coordinates and in declination, as well as the circle lines, intact.
2.2.1. PPL ¢ Planetary Price Line.
This is a kind of planetary lines transforming a planetÆs position into a price. It is a sor of price analysis from the point of view of planetary positions.
Let us consider an example of building planetary line for the helio-centric Venus (the method is the same for any planet and line of this type).
Let us open the window Planets Hierarchy, select the Venus and the Price branch and at last the Geo option.
Let us then right-click on the Geo to open the context menu and select Tune (see the chart below) to switch the settings panel:

As we have right-clicked at the third level of the tree (Geo), the first three parameters are already selected and cannot be changed (Venus, Price, Geo-G). Let us then set the (Harmony) for the lines:
1 ¢ draws a planetary line (conjunction),
2 ¢ draws the 2nd Harmony (conjunction and opposition),
3 ¢ draws the 3rd Harmony (conjunction, trigon),
4 ¢ draws the 4th Harmony (conjunction, quadrature and opposition) etc...
Mirror ¢ sets a mirror reflection at a 0 degree of Aries (in this example let us leave this box unchecked).
A context menu will set the price-degree transformation ratio. Each security has its own optimal transformation ratio value which corresponds to its price range (e.g. if the price range is from 500 to 900, the optimal value will most likely equal 1, for the price range of 2 to 10 ¢ the ratio is 0.01 etc.) If you entered a wrong value by mistake, select this Harmony in the tree and delete it (right-click and select ōDeleteö in the context menu).
Our next step is setting the circles parameter ¢ the number of complete 360 degrees cycles. As a planetÆs position (angle) can vary within the range of 0 to 360 degrees, transforming degrees into price units we get the maximum value of 360 and to deal with prices higher than 360 we have to add 1 circle, with those higher than 720 ¢ 2 circles etc. We can also set the lines width and color.
After setting all the parameters we press ōAddö which will create a new level in the planets tree (the harmony level for the planetary line containing all of its aspects) and plot the planetary line (lines) on the chart. It should be noted that the symbol  against the level in the tree means that the planetary line will be shown on the chart, the sign
  means that the line will be hidden and if there is the
  sign, the line is outside of the price range.
On the chart below you can see the planetary lines of Venus with the following settings: 4th Harmony, price-degrees transformation ratio =1, the number of full cycles = 2. The chart shows the 0 aspect (bold line), -90, 90 and 180 degrees aspects; as for those of ¢ 180, -270 and 270 degrees, they are out of the price range.

2.2.2. PčL ¢ Planetary Circle Line.
Planetary Circle Lines are natural cyles based upon the calculation of the movement of a planet. Underlining this analysis is the theory that important price moves (reversal points) are influenced by certain planetary phenomena (positions). The knowledge of this fact allows to forecast the future date when the same phenomenon will take place (that is to calculate the period of the cycle).
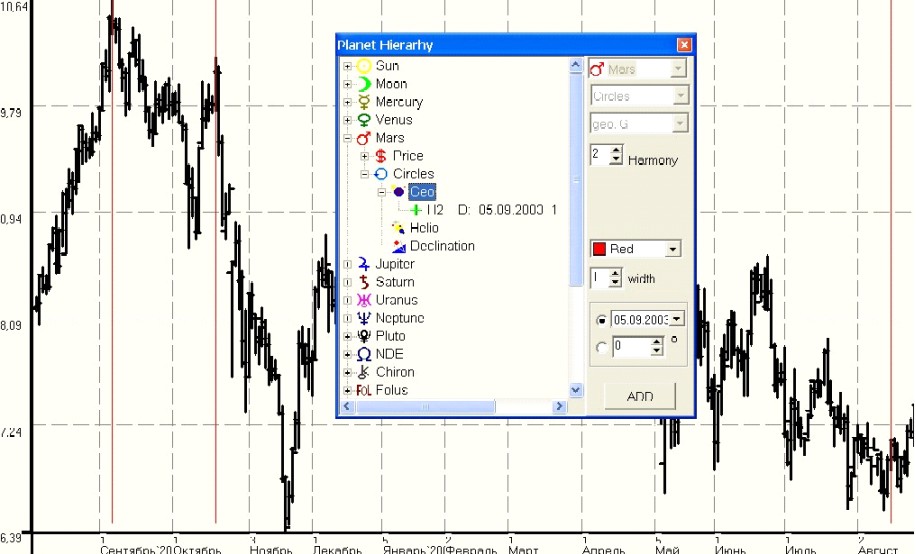
For example let us look at the position of the Mars on September 05, 2003 when the price of the ōRAO EESö (The Unified Energy Systems of Russia Inc.) stocks formed an important high at 10,648 roubles. If we apply the cycle with the 2nd Harmony (i.e. taking into account the current and the opposite (-180░) position of the Mars) we will see an important high of October 20, 2003 at 10,187 roubles (the same position of the Mars) and an important low of August 12, 2004 at 6,57 roubles (not far from the position of the Mars opposite to the starting date ¢ 09/05/2003).
For this we should do the following: 1) choose a planet (in our case the Mars); 2) specify the type of the planetary as Circles; 3) select the geo- or helio- coordinates or the declination of the planet (in our case we have the the Mars in the geo coordinates).
After that we should right-click on the Geo symbol to open the context menu and to select the ōTuneö (ōConfigureö) entry. On the panel that will appear on the right we should do the following: 1) Specify the Harmony: 1 for the same position and 2 for the same and the opposite - 180░ position, 3 ¢ the same position and each 120░ etc.) ; 2) set the color and the width of the line ; 3) specify the key date.
Pushing ½ADD╗ will plot the chosen planetary circle line in the chart.
The second way to build a planetary cycle is to look at the position of a planet under given sign of the Zodiac.
For this we use the absolute value of the angle (0-360˚). For example, to calculate the cycle of the Mars for its ingressions in any sign of the Zodiac we should: 1) select a planet (the Mars); 2) specify the type of line as Circles; 3) choose the geo- or helio-centric coordinate or the declination of the planet (in our case it is Mars in the geo coordinates).
After that we should right-click on the Geo symbol to open a context menu and select ōTuneö. On the panel that will appear on the right let us do the following: 1) Specify the Harmony: in our case ¢ 12 (360/12=30 and 30˚ is the value of each sign of the Zodiac); 2) set the color and the width of the line ; 3) select the bottom box of the panel and set the value in degrees (in our case ¢ 0).
Pushing ½ADD╗ will plot the chosen planetary circle line in the chart.

Back to Content