MGA - Master Gann Analyzer
Manual
v.3
2.3. лMaster Charts╗ menu.
2.3.1. Square of 9.
Starting with version v.2.4. of the MGA program you can use the Square of 9 template. To open this module select Master Charts in the program menu or click
 on the toolbar. You will then see the лMaster Time & Price Chart Ц Square9╗ window:
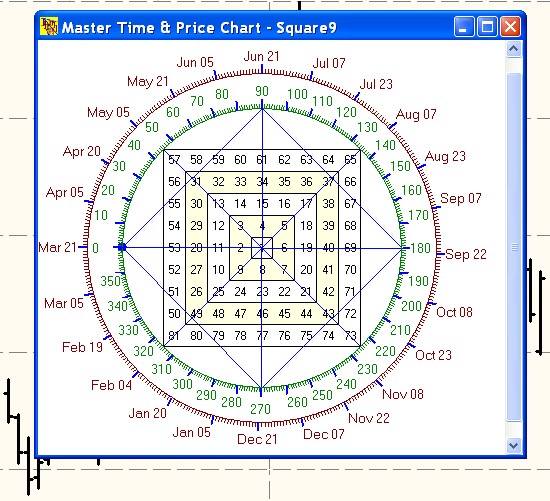
For your convenience, the window contains nothing but the picture of the template.
In the picture you can see the numbers ascending spirally from the center of the square at a certain step (by default Ц 1).
Around the square there is a degrees circle and a calendar circle.
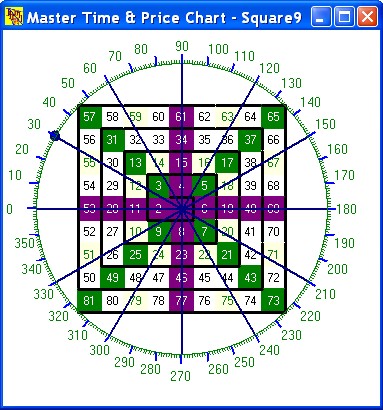
The circle can be divided by special overlays. By default Ц it is a square with diagonals dividing the circle into 8 parts.
Let us now look at the Square9 itself:
The Square of 9 is a combination of universal geometrical figures Ц circle and square. The first square includes 9 numbers, whence the title УSquare of 9Ф. 9 Ц is the most important number, Уthe measure all the thingsФ. Adding any number to 9 and returning it to 1-digit number (the base of the decimal system) we get the same number again, for example: 1+9=10 1+0=1, 4+9=13 1+3 =4 etc. Multiplying a number by 9, we will get 9 again: 2*9=18 1+8=9, 4*9=36 3+6=9 etc.
Each square contains (2n+1)2 figures. At the angle of 45░ in the first cycle there is 1 figure, in the second cycle Ц 2 figures etc.
The circle surrounding this square is the Zodiacal circle beginning on March 21 at 0 degrees of Aries. The circle is divided into 8 sectors: by the vertical and horizontal lines (the so called Уcardinal linesФ) and two diagonal lines (the so called Уfixed linesФ). According to Gann, support and resistance levels must be situated on these lines.
All the operations with the template are available through a context menu which can be activated by a right-click of the mouse.
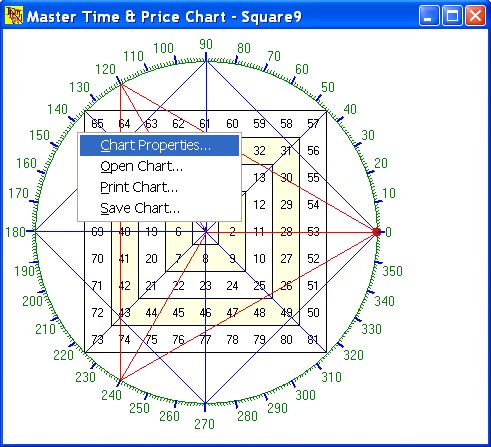
- лChart PropertiesЕ╗ - launches a window where you can configure the template parameters and colors.
- лOpen ChartЕ╗ - opens a previously saved template file.
- лPrint ChartЕ╗ - sends the template image to the printer. If the printer resolution allows it, the image will be printed on 1 page, otherwise (most frequently) Ц on multiple pages.
- лSave ChartЕ╗ - saves all the settings of the template in a file.
Let us study in more detail the first menu item (all the others being standard Windows operations of file printing, saving and opening).
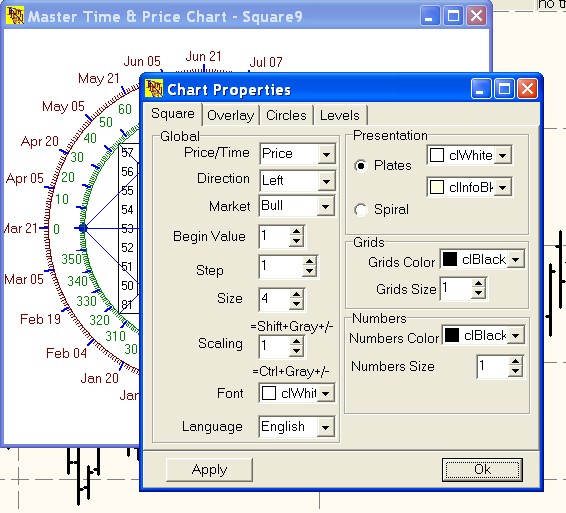
After selecting the лChart PropertiesЕ╗ entry the user will see a window with several tabs.
The лSquare╗ tab
Contains the settings of the numeric Square.
-
The лGlobal╗ group contains:
Price/Time.
Price - configures a square consisting of numeric values.
In the Begin field you enter a number which will be placed into the central cell of the square.
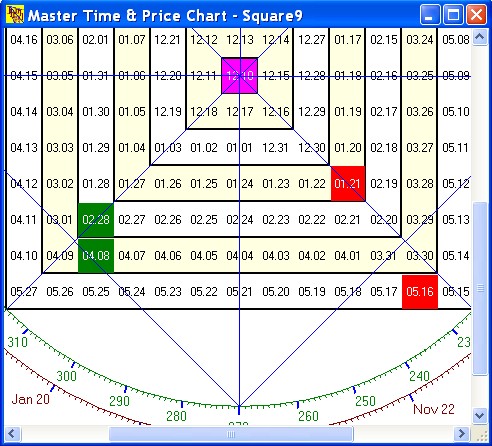
Time configures a square consisting of dates.
In this case the Begin field must contain a date, which will be the placed into the central cell of the square.
The chart on the left is an example of the Square for the Lukoil stocks. The base number is the low of December,10 2004.
The format of the dates can be configured in the Numbers frame with the Format combobox. The examples format is лmm.dd╗ (12.10 will stand for December 10, 2004).
- Direction combobox.
The user has to choose between Right and Left.
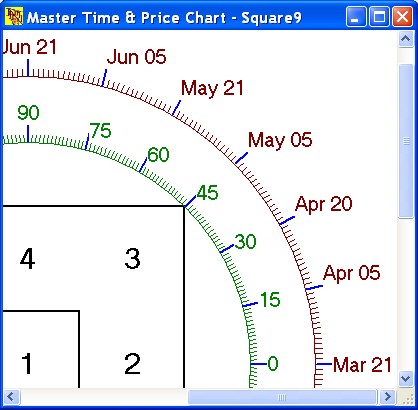
Choose Left (by default) to set the zero value of the degrees circle and that of the calendar circle to March 21 on the left of the window. In this case the square will be filled with values clockwise.
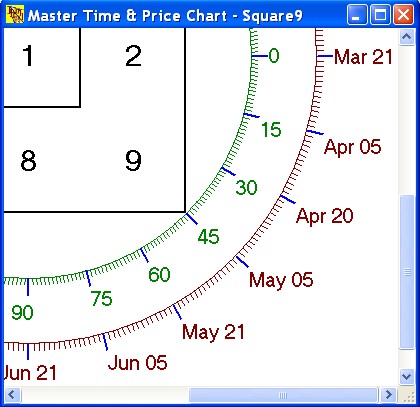
Choose Right to set the zero value of the degrees circle and that of the calendar circle to March 21 on the right of the window. In this case the square will be filled wil values anticlockwise.
The direction can also be changed with with the keyboard (without opening the settings dialog box) by pressing Ctrl + Left (to select Left) or Ctrl + Right (to select Right).
- Market
Choose between the Bullish or Bearish market.
In the лBullish╗ square the increment between consecutive dates or numbers is positive. The numbers increase УspirallyФ aside from the center (to the left or to the right, depending of the Direction) and upwards.
In the лBearish╗ square the increment between consecutive dates or numbers is negative. The numbers decrease УspirallyФ aside from the center (to the left or to the right, depending of the Direction) and downwards.
For example, you can place a historical price of a security into the central cell and see how the price is decreasing within the square, searching for support and resistance levels in the angular cells of the square.
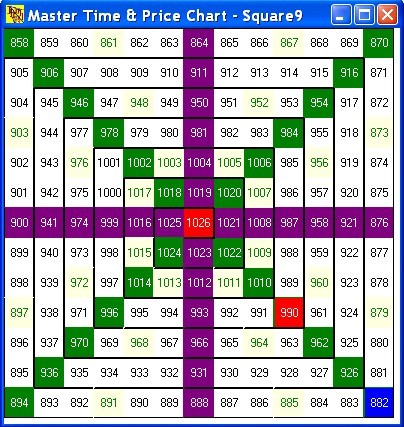
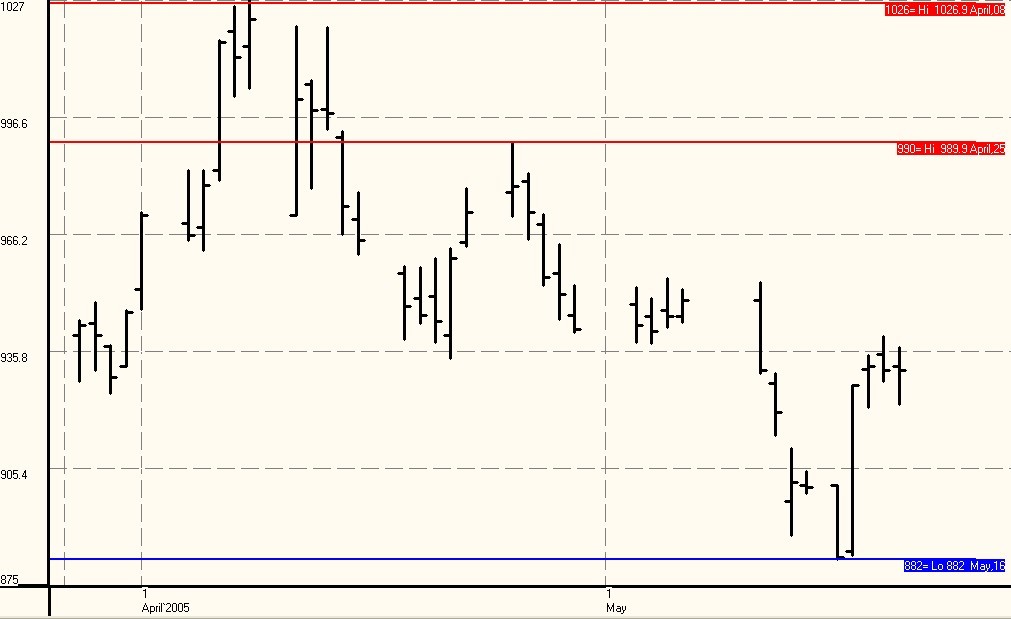
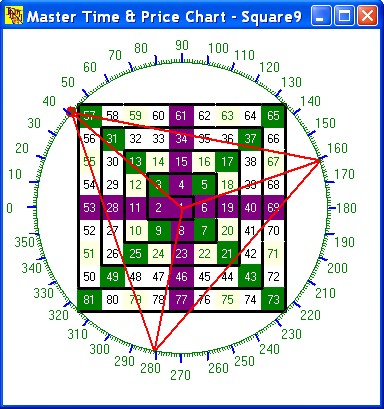
The chart on the left is an example of using the square with the Lukoil stocks. The base number is the High of 1026 (1026,9 as of April, 08 2005). On the right bottom diagonal of the square (the so-called Уfixed crossФ) we can see the numbers 882 (the Low of 882 as of May, 16 2005) and 990 (the High of 989 as of April, 25 2005).
- Step.
Sets the increment between consecutive numbers (dates) withing the square.
- Size.
Sets the dimension of the square or the number of spirals. This value can vary starting from 1, when only the 9 base numbers will be shown. You can modify the value of this parameter with the keyboard (without using the settings dialog box) pushing the keys Shift+ Gray+/- (hold down УShiftФ, and press grey У+Ф or the grey У-У to increase/decrease the Size).
- Scaling.
Sets the scaling of the square. 1 (by default) corresponds to 100% zoom so that the whole image can be viewed on the screen without using the scrollbars. Increasing this parameter will enlarge the image so that it will be larger than the window. (to view the hidden parts you can use Windows standard scrollbars on the right and at the bottom of the window).
You can modify this parameter using the hotkey combination Ctrl+ Grey+/- (holding down УCtrlФ press the grey У-У or У+Ф to decrease/increase the parameter).
- Background
Allows you to set the background color of the window you prefer. By default Ц the color is white (лclWhite╗).
- Language.
Changes the interface languages of the module.
- Appearance group contains:
Radio-buttons allowing you to set the appearance of the square.
Selecting Plates will create a square consisting of plates with the option of setting the colors of consecutive plates. Their colors can be the same or different.
Selecting Spiral will create a spiral-like square, resembling the view from the top of a pyramid one sees while descending it.
The Cross tab
Besides, in the settings window there will also appear the Cross tab where you can configure the dimensions and colors of the numbers situated on the corresponding crosses.
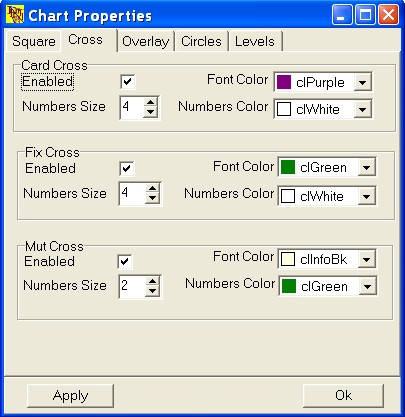
The Cardinal Cross Ц numbers situated on the horizontal and vertical lines (0, 90, 180 and 270 degrees);
The Fixed Cross Ц numbers situated on the diagonals (45, 135, 225 and 315 degrees);
Mutable cross Ц numbers situated between the cardingal and the fixed cross.
The лGrids╗ group:
Here you can configure the color and the width of the gridlines of the square.
The лNumbers╗ group:
Allows you to configure the color and the dimension of the numbers (dates) of the square. If the Presentation (appearance) of the square is Spiral the format of the numbers situated on the crosses will be that of the Crests tab.
The лOverlay╗ tab
contains settings for three geometrical figures which can be overlaid on the square (square, triangle, dodecagone):
- Square group

To plot a square check the лEnabled╗ field and select the лColor╗ and the лWidth╗ of the lines you prefer.
The лSet null point to degree╗ field allows to set the zero point for the square at a certain degree of the circle. You can enter the necessary number (from 0 to 359 degrees) into this field or press лPgUp╗ or лPgDn╗ to increase/decrease the value of the field by 1.
Besides, you can modify this parameter using the mouse: place the mouse pointer on the initial value of the square (it is marked on the degrees circle by a small balloon). The mouse pointer will change its form (usually, from an arrow to a hand with a finger stretched out, but it depends on the general settings of your computer).
As soon as it happens you can push the left button of the mouse and, holding it down, move the pointer along the circle. This will make the square move in the same direction as the pointer. As soon as the initial point (zero level) has reached the necessary position (degree) release the button and the square will be plotted in the newly selected place.
- Triangle Overlay
To plot a triangle check the лEnabled╗ field and select the лColor╗ and the лWidth╗ of the lines you prefer.
The лSet null point to degree╗ field allows to set the zero point of the triangle at a certain degree of the circle. You can enter the necessary number (from 0 to 359 degrees) into this field or press лCtrl+PgUp╗ or лCtrl+PgDn╗ to increase/decrease the value of the field by 1.
Besides, you can modify this parameter using the mouse: place the mouse pointer on the initial value of the triangle (it is marked on the degrees circle by a small balloon). The mouse pointer will change its form (usually, from an arrow to a hand with a finger stretched out, but it depends on the general settings of your computer).
As soon as it happens you can push the left button of the mouse and, holding it down, move the pointer along the circle. This will make the triangle move in the same direction as the pointer. As soon as the initial point (zero level) has reached the necessary position (degree) release the button and the triangle will be plotted in the newly selected place.
- Dodecagone Overlay
To plot a dodecagone (each 30 degrees are displayed) check the лEnabled╗ field and select the лColor╗ and the лWidth╗ of the lines you prefer.
The лSet null point to degree╗ field allows to set the zero point for the dodecagone at a certain degree of the circle. You can enter the necessary number (from 0 to 359 degrees) into this field or press лShift+PgUp╗ or лShift+PgDn╗ to increase/decrease the value of the field by 1.
Besides, you can modify this parameter using the mouse: place the mouse pointer on the initial value of the dodecagone (it is marked on the degrees circle by a small balloon). The mouse pointer will change its form (usually, from an arrow to a hand with a finger stretched out, but it depends on the general settings of your computer).
As soon as it happens you can push the left button of the mouse and, holding it down, move the pointer along the circle. This will make the dodecagone move in the same direction as the pointer. As soon as the initial point (zero level) has reached the necessary position (degree) release the button and the dodecagone will be plotted in the newly selected place.
The лCircles╗ tab
allows to set the properties of the external circles surrounding the square.
- The лMarket╗ frame includes two switches: лBull╗ and лBear╗.
Set лBull╗ to make degrees and dates of external circles increase upwards, set лBear╗ - to make them increase downwards.
|
|
|
Bull
|
Bear
|
- The next tab contains:
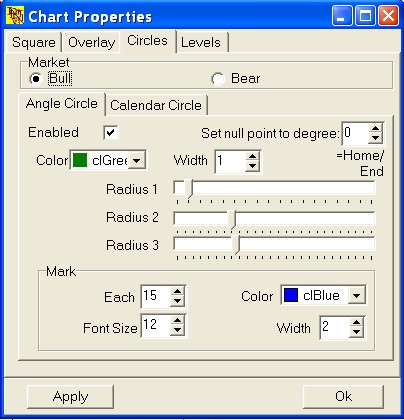
лAngle Circle╗ (Degrees Circle) and лCalendar Circle╗ .
The лAngle Circle╗ allows to configure the external circle with degrees as labels.
To overlay this circle on the square check the лEnabled╗ field, set the лColor╗ and the лWidth╗ of the lines you prefer.
The лSet null point to degree╗ field allows to set the zero point of the degrees circle. You can enter the necessary number (from 0 to 359 degrees) into this field or press лHome╗ or лEnd╗ to increase/decrease the value of the field by 1.
Besides, you can modify this parameter using the mouse: place the mouse pointer on the initial value of the degrees circle (it is marked on the degrees circle by a small balloon). The mouse pointer will change its form (usually, from an arrow to a hand with a finger stretched out, but it depends on the general settings of your computer).
As soon as it happens you can push the left button of the mouse and, holding it down, move the pointer along the circle. A line from the center of the circle will appear which will move in the same direction as the mouse. As soon as the initial point (zero level) has reached the necessary position (degree) release the button and the circle will be plotted in the newly selected position.
The лRadius 1╗ field allows to modify the overal size of the circle, the лRadius 2╗ - to modify the size of all the labels of the circle, the лRadius 3╗ - to modify the size of the selected labels on the circle.
To change these parameters place the mouse pointer on the scrollbar runner, press the left key of the mouse and, holding it down, move the runner to the right or to the left. The window will be refreshed automaticly as you move the runner.
With the лMark╗ frame you can configure the лColor╗, лWidth╗ and лFont size╗ of the selected degree labels, as well as the number of labels to show Ц the лEach╗ field.
The calendar circle can be configured in the same way. The only exception is that to set the zero point from the keyboard you have to use the лCtrl+Home╗ and лCtrl+End╗ combination to increase/decrease the parameter.
The лLevels╗ tab
contains settings allowing you to display certain levels on the square and the chart.
In the first frame there are three buttons:
- лDegree╗ - marks all the numbers of the square lying below the line crossing its center at a certain degree (from 0 to 359).
- лDate╗ - marks all the numbers of the square lying below the line crossing the center of the square and a certain date of the calendar circle (independantly from the year).
- лNumber╗ - finds a selected number in the square and marks it. If the type of the square is УTimeФ (Square\Global\PriceTime Ц> УTimeФ) the name of this field will be changed to УDateФ and it will contain a dropdown calendar.
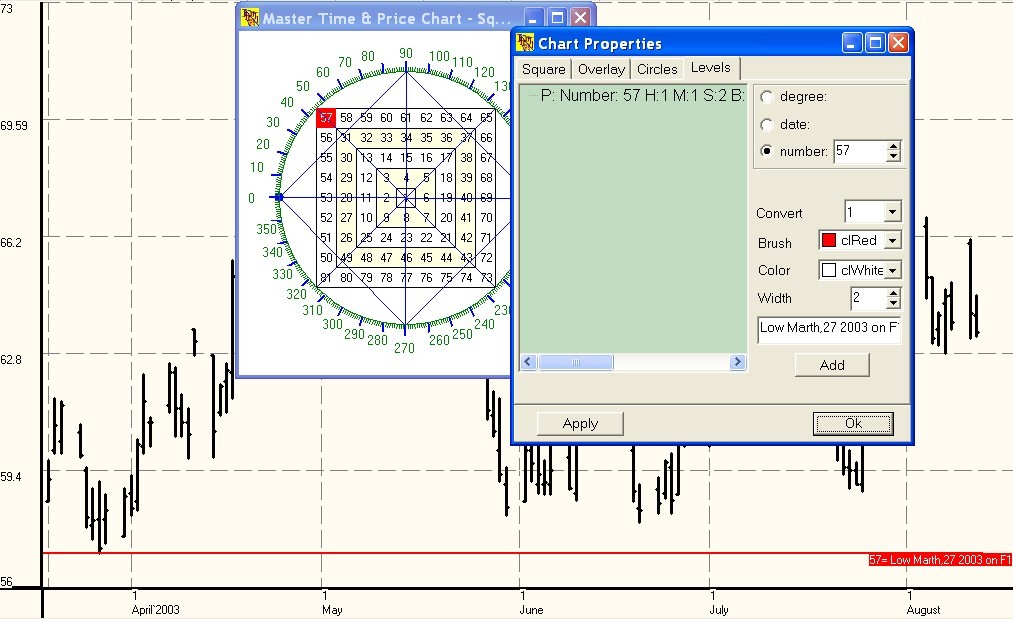
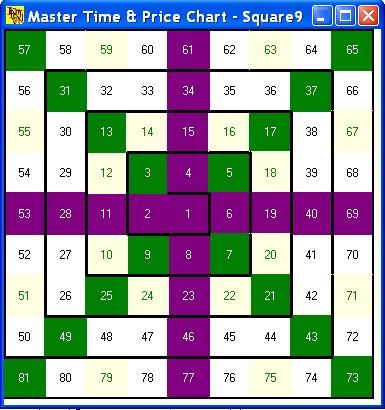
Here is an example of entering a level:
The number 57, entered into the лNumber╗ field is displayed both in the template window and on the chart as the $57 price level (coffee). The drowdown menu лConvert╗ sets the the number/price conversion ratio according to the following formula:
Price = Number * Conversion Ratio.
The fields лBrush╗, лColor╗ and лSize╗ allow you to set a specific way the numbers and corresponding prices will be marked in the template window and on the chart. In this example we have red font against the white background. There is also a field for your comments where a short text can be entered to explain the importance of this number (level).
In the current example we have: лLow Marth,27 2003 on F1╗ (an important low situated on the fixed cross) Ц this text is displayed on the chart (just under the price level and on the right). If the mouse pointer in the template window is on the marked cell the same comment will be shown in the form of a tooltip. When a Template is printed all the comments are printed after the image.
When we enter a level for a degree or a date on the external circles, first of all the лHarmony╗ field is shown, enabling you to enter not only the level but the corresponding harmonies. Secondly, the лColor╗ field appears, as the levels are plotted only one backround color. You can also add a comment here.
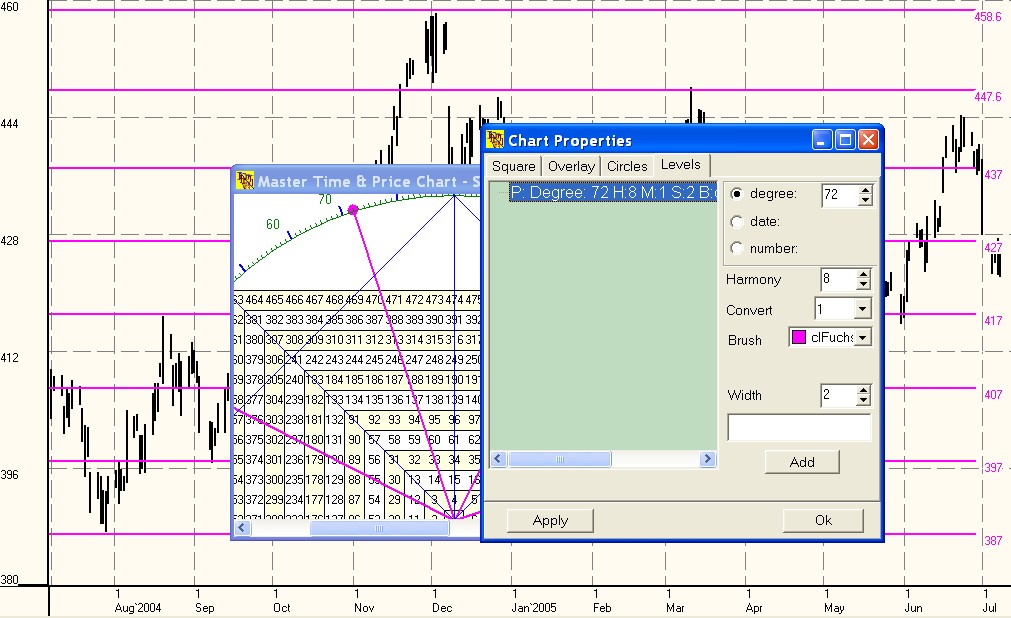
In this example (gold) we have the following settings: degree Ц 72, harmony Ц 8, color Ц violet, width Ц 2. In the template window you can see the lines crossing the 72nd and 27th degrees (72-45=27. 360/8=45).
The end of the first line is marked with a small balloon, which means that this is the main line, while the others are its harmonies. All the numbers of the square situated below this level will be transformed into price levels with a certain conversion ratio (in our case Ц 1) and displayed on the chart. The second line of this level crosses 458 which corresponds to a High of 458,2.
The procedure for entering calendar circle levels is the same.
The лAdd╗ button adds the configured level parameters to the list.
In the list of selected levels you can right-click a line to activate a context menu containing the лDelete╗ option which will remove unnecessary levels from the template and from the chart.
Context menu
Contains 5 items:
- Chart PropertiesЕ
To open the chart template properties window
- Open ChartЕ
To load a template saved earlier (a file with the *.sq9 extension).
- Print ChartЕ
To print a chart. At first the standard Windows УPrintФ dialog box will be launched. The chart can be printed on several pages.
- Save ChartЕ
To save the current workplace (all the functions and other analysis tools you have plotted) in a file with the *.sq9 extension.
Back to Content