MGA - Master Gann Analyzer
User's guide
v.3
Swings
To perform a more detailed swings analysis (in comparison to that available in the functions block) select this menu item or click the  button of the toolbar. The лSwings╗ window will be launched:
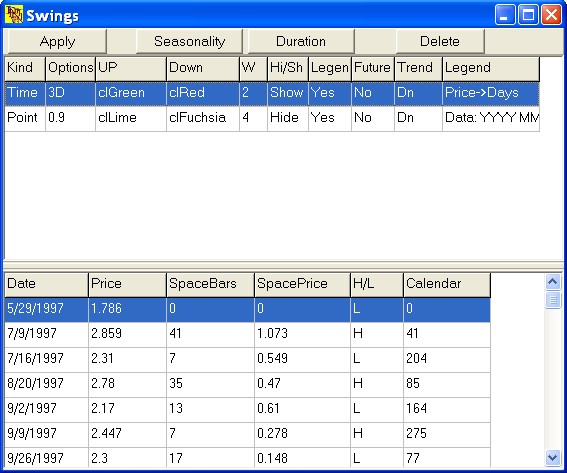
The window consists of two parts, the first containing the list of all the calculated swings, the second Ц the list of highs/lows for the current (selected) swing.
There are two kind of the swings:
- Time swings - User wants to see some number of the consecutive highs or lows (ex. 3D - 3 consecutive Hi/Lo on daily chart, 2M - 2 consecutive Hi/Lo on monthly chart).
- Points swings - User wants to see some points (and more) for corrections from last move (ex. 9-Points swing - price must to drop down by 9 points from hight)
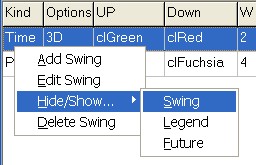
Many operations with in this window are available through a context menu which can be activated by a right-click of the mouse:
|
|
|
Time swings
|
Point's swings
|
To add a swing you should click at the "Add Swing" in popup menu and window of the swing's options will be launched:

- Kind of swing - check the kind of the swing and enter parameter(s)
- bull's color - set color of the bull move in swing
- bear's color - set color of the bull move in swing
- width - width of the lines
- the лFuture╗ parameter allows you to plot the projection of the previous swing into the future Ц a very useful feature, enabling you to see the future support/resistance levels. For example, retracements in a bullish trend must be less than, or the same as, the previous retracement.
- Legend - list of the legends.
- Button "Cancel" - cancel and hide option's window
- Button "Add" - add swing in the chart and in the swings table; hide option's window
Having configured a swing push the лAdd╗ button to add the swing to the the listbox.
In addition to the parameters you have set, you will see the following settings:
Х лTrend╗ - shows the trend of the current movement: Up Ц bullish, Dn Ц bearish.
Х лHi/Sh╗ - hides away, or shows, fluctuations on the chart. The default value is лHide╗. To modify its value quickly double-click on the corresponding cell of the table.
To remove an unnecessary swing push the лDelete╗ button or click "Delete swing" in popup menu which will delete the corresponding row from the tables at the top and at the bottom of the УSwingsФ window.
To Edit a selected swing right-click on the corresponding row to open the context menu:
The menu item - лEdit Swing╗ - openes option's window and places the swing parameters to the window's form where you can modify them, show the лEdit╗ button and disables the лAdd╗ button.
The menu entry - лHide/Show...╗ - openes submenu:
- The submenu item "Hide/Show... Swing" has the same effect as the double click of the mouse: it shows or hides fluctuation lines from the chart.
- The submenu item лHide/Show... Legend╗ hides or shows text labels against the tops/bottoms of the swings.
- The submenu item лHide/Show...Future╗ hides or shows the projection of the swing into the future, based upon the past movement of the previous swing.
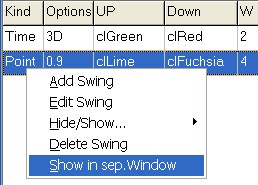
If kind of the swing is Point's swing there are once more menu item in popup menu:
"Show in sep.window"
This menu item openes separatly window for a point's swing:
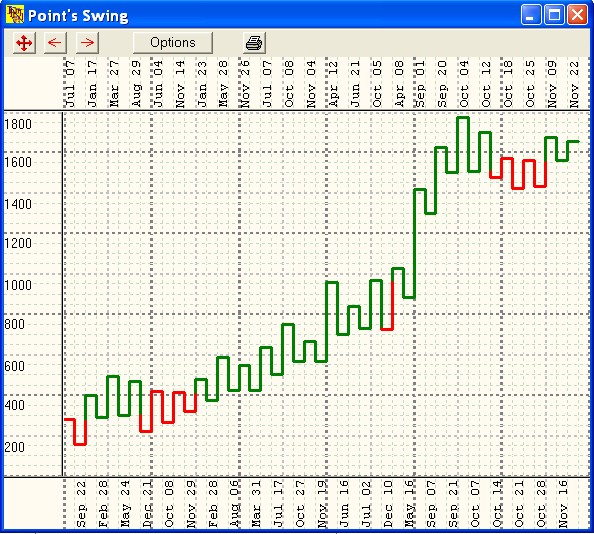
User may to change options this window and print point's swing chart.
To change options push the button "Options" - option's window will be launched:
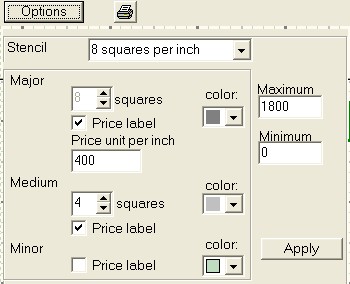
With puldown menu Stencil - user may to change visual presentations of the chart.
W.D. Gann used 8 square in inch, 12 square in inch chart's paper. You may to use it or choose the "user options".
In the "Major line box" you may input count squares on inch (in "user's options" only), color of the line, needs the programm to draw price legend on Y-Axis at major division."Price unit per inch" sets price scale.
In the "Medium line box" you may input how many squares on inch programm must draw medium line (not more that Major), color of the line, needs the programm to draw price legend on Y-Axis at medium division.
In the "Minor line box" you may choose color of the line, needs the programm to draw price legend on Y-Axis at minor division.
The "Maximum" field sets maximum's price in the chart, and the "Minimum" field sets minimum's price in the chart.
Button "Apply" applyes the options and close option's window.
Clicking on a given swing you can view all its tops and bottoms in the following way:
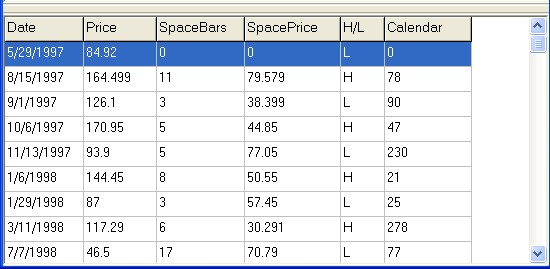
Date Ц Date of the extremums (swing)
Price Ц Price of the extremums (swing)
SpaceBars - Duration in trading days (in terms of bars)
SpacePrice - Duration in terms of price units
H/L - Is it a High or Low
Calendar - Duration in calendar days
Within this table you can use a context menu consisting of two entries:
1) лEdit╗ - select this item to activate a toolbar for editing swing highs and lows and push the лChange╗ button;
2) лDelete╗ - this option allows to delete highs and lows in pairs. (to do it select 2, 4, 6 etc. rows in the table using the mouse and the УCtrlФ and УShiftФ buttons). The necessity to delete swings in pairs is explained by the fact that after a high of the swing is succeeded by a low.
In the same window there are two additional buttons:
лSeasonality╗
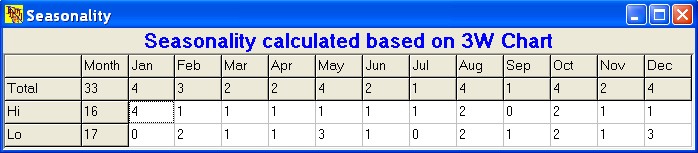
лSeasonality╗ - opens additional windows where you can analyze the seasonality of a chosen swing, i.e. how many tops/bottoms there are in each month. The recommended swing value for such an analysis is 3W or 2M (depending on the security).
лDuration╗
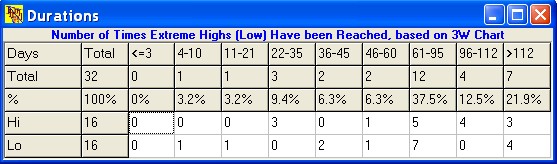
лDuration╗ - opens additional window allowing to analyze the average duration of the campaign for the selected swing. This analysis shows you the average number of days in the bullish and bearish trend, i.e. how many extremes (highs and lows) of the swing belong to each month.
Back to Content